
Having a window into what all the systems you own are up to can be essential to fix bottlenecks, fix issues or is predict and correct coming issues before they can have any impact. This is where we see the overlap between monitoring and obserability. In this post, we are going to go over how you can set up a basic monitoring and obserability system with Prometheus, Node Exporter and Grafana. This can be deployed quickly within a homelab or just as equally within enterprise.
Section I – What is Monitoring and Obserability?
Before we start it makes sense to lay the knowledge foundation to get us all on the same page.
What do I mean when I say monitoring? Monitoring refers to the continuous observation and measurement of software, hardware, and services to ensure their health, availability, performance, and reliability. The primary goal is to detect problems before they impact users, support troubleshooting, and provide data for capacity planning and optimisation.
So what about obserability? Observability is the practice of deeply understanding the internal state, behaviour, and performance of complex applications and infrastructure by analysing their outputs namely metrics, logs, events, and traces. It goes beyond basic monitoring, enabling you to proactively detect, diagnose, and resolve issues by correlating data from multiple dimensions, especially in distributed, cloud-native environments.
The important take aware is that both monitoring and obserability overall serve the purpose of IT Operations that do serve separate functions. Monitoring is about tracking known conditions, with pre-set dashboards and alerts. Observability is about exploring unknowns answering why something happened, not just what happened, with flexible data analysis and querying.
Section II – What are Metrics?
Relevant to the platform we are going to establish today I want to just cover off what I mean by metrics. Metrics are numerical measurements sampled at regular intervals, representing quantitative aspects of system performance (e.g., CPU usage, memory consumption, request rates, error counts). Metrics are lightweight and structured, making them easy to store, query, and visualise. They are essential for understanding trends over time, setting thresholds, and triggering alerts.
Section III – Grafana, Prometheus & Node Exporter
Before we get into the configuration of each of these components lets quickly have a high level overview of what each of them do.
Starting with Grafana. Grafana is a powerful open-source monitoring and observability platform for visualising, monitoring, and analysing metrics, logs, and trace data from many different sources. It is highly valued for its flexible dashboard creation, real-time monitoring, and wide compatibility with data sources like Prometheus, InfluxDB, Loki, MySQL, PostgreSQL, Elasticsearch, etc.
Prometheus is an open-source monitoring and alerting system designed for gathering and analysing time-series metrics data from servers, applications, and services. It’s a core part of modern observability stacks and is known for its scalability, robust data model, and alerting.
Node Exporter is an official open-source monitoring agent designed for Prometheus that collects and exposes detailed hardware and operating system metrics from Linux and Unix systems.
I have also put together a quick diagram to show how the 3 components interact. It works by Node Exporter running on the device we want to collect metrics on, it will then publish these locally on the port 9100. Prometheus will be set up at a defined interval to go to the Node Exporter endpoint and scrape the metrics it has published and then it will store them in its local database. Then we can set up Grafana to query Prometheus’s database in order to visualise or dig deeper into those metrics.

Section IV – Prometheus Installation
I am going to assume that you already have a Linux based server set up and good to go. In my case I am running Fedora server instance.
It is always good practise to make sure that your OS is fully up to date:
dnf update -y
Then we need to make sure we have 2 packages installed:
dnf install curl wget -y
Navigate to the Prometheus Github page releases and copy the link for the latest release for your systems architecture:
https://github.com/prometheus/prometheus/releases
Back on your Linux CLI use the wget command to get the package:
wget (URL)
For example I am doing:
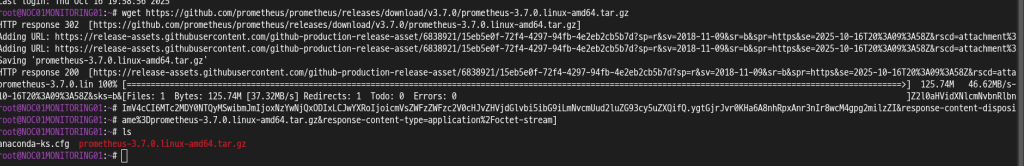
Extract the contents from the downloaded tar file:
tar -xvf (tar file)

Now we have all the files we need to make sure they are moved into the correct locations. We can start this by creating the Prometheus directories:
mkdir /etc/prometheus
mkdir /var/lib/prometheus
Then we need to move the Prometheus files into those new directories:
mv prometheus-3.7.0.linux-amd64/prometheus /usr/local/bin
mv prometheus-3.7.0.linux-amd64/promtool /usr/local/bin
mv prometheus-3.7.0.linux-amd64/prometheus.yml /etc/prometheus/
We want to have this Prometheus application run as a service via a dedicated user account so lets make that account:
useradd –no-create-home –shell /bin/false prometheus
Now we have the user we need to make sure that the user can access those files:
chown -R prometheus:prometheus /etc/prometheus /var/lib/prometheus
chown prometheus:prometheus /usr/local/bin/prometheus /usr/local/bin/promtool
Finally lets get this to run a a service by creating a new service unit file:
vi /etc/systemd/system/prometheus.service
Then put in the following contents:
[Unit] Description=Prometheus Monitoring System Wants=network-online.target After=network-online.target [Service] User=prometheus Group=prometheus Type=simple ExecStart=/usr/local/bin/prometheus \ –config.file=/etc/prometheus/prometheus.yml \ –storage.tsdb.path=/var/lib/prometheus/ [Install] WantedBy=multi-user.target
Then we need to reload systemd to see the new service unit file and then start the service and get it to start on boot:
systemctl daemon-reload
systemctl enable prometheus
systemctl start prometheus
If you have problems with the service not starting stating a problem like permission denied then you can do the following to fix it:

Within my set up I have SELinux enforcing, and for security best practises here the solution isn’t just to disable SELinux. I did so just to prove it was causing the problem.
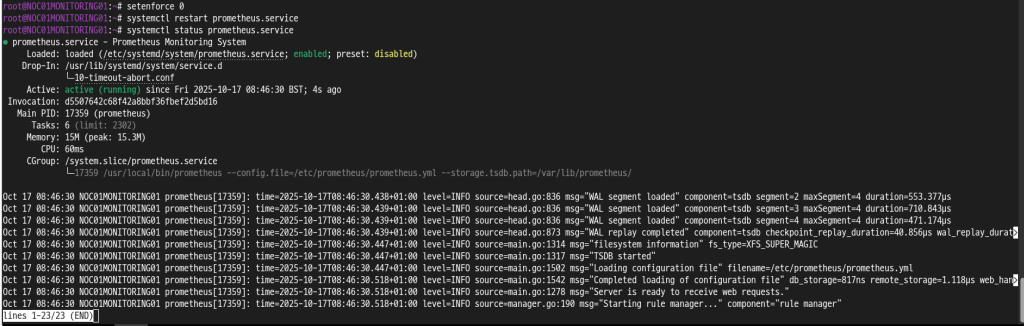
Then I switches SELinux back to enforcing and issues the following command and then restarted the Prometheus service:
restorecon -v /usr/local/bin/
If your Prometheus server is on a separate device to where the Grafana instance will be then you need to open up the firewall on the device:
firewall-cmd –add-port=9090/tcp
firewall-cmd –add-port=9090/tcp –permanent
Section V – Node Exporter Installation
With Prometheus installed now we can navigate to the CLI of the device that we want to collect metrics on.
Like before it is always good practise to make sure that your OS is fully up to date:
dnf update -y
Then we need to make sure we have 2 packages installed:
dnf install curl wget -y
Navigate to the Node Exporter Github page releases and copy the link for the latest release for your systems architecture:
https://github.com/prometheus/node_exporter/releases
Back on your Linux CLI use the wget command to get the package:
wget (URL)
For example I am doing:

Extract the contents from the downloaded tar file:
tar -xvf (file name)

Move files into correct location:
mv node_exporter-1.9.1.linux-amd64/node_exporter /usr/local/bin/
We want to have this Node Exporter application run as a service via a dedicated user account so lets make that account:
useradd –no-create-home –shell /bin/false node_exporter
Now we have the user we need to make sure that the user can access those files:
chown node_exporter:node_exporter /usr/local/bin/node_exporter
Finally lets get this to run a a service by creating a new service unit file:
vi /etc/systemd/system/node_exporter.service
Then put in the following contents:
[Unit] Description=Node Exporter [Service] User=node_exporter ExecStart=/usr/local/bin/node_exporter [Install] WantedBy=multi-user.target
Then we need to reload systemd to see the new service unit file and then start the service and get it to start on boot:
systemctl daemon-reload
systemctl enable node_exporter.service
systemctl start node_exporter.service
Due to Prometheus calling to Node Exporter to scrape the metrics we need to make sure the port is allowed through the host firewall:
firewall-cmd –add-port=9100/tcp
firewall-cmd –add-port=9100/tcp –permanent
Section VI – Prometheus Configuration
With Node Exporter set up and working on the device we want to collect metrics from we now need to make sure Prometheus is configured to know where to look in order to get those metrics.
On the server that is running your Prometheus instance open up the Prometheus configuration file:
vi /etc/prometheus/prometheus.yml
Then add the IP of the server running Node Exporter and the port to the targets of the static configs:
scrape_configs:
    - job_name: "prometheus"
      static_configs:
        - targets: ["localhost:9090",
                    "localhost:9100",
                    "<IP>:9100"
                   ]
With the Prometheus configuration file updated we need to restart the service:
systemctl restart prometheus
Section VII – Grafana Installation
The final application we need to install is Grafana. This is the platform that will allow us to easily view all that data Prometheus is not collecting from Node Exporter.
First we need to add the Grafana repository which can differ depending on if you are on Red Hat based Linux or Debian based.
On Debian do the following two commands:
curl -fsSL https://packages.grafana.com/gpg.key | gpg –dearmor -o /etc/apt/trusted.gpg.d/grafana.gpg
echo ‘deb [signed-by=/etc/apt/trusted.gpg.d/grafana.gpg] https://packages.grafana.com/oss/deb stable main’ | tee /etc/apt/sources.list.d/grafana.list
On Red Hat based do the following to import the GPG key:
wget -q -O gpg.key https://rpm.grafana.com/gpg.key
rpm –import gpg.key
Then add the repo file:
vi /etc/yum.repos.d/grafana.repo
[grafana]
  name=grafana
  baseurl=https://rpm.grafana.com
  repo_gpgcheck=1
  enabled=1
  gpgcheck=1
  gpgkey=https://rpm.grafana.com/gpg.key
  sslverify=1
  sslcacert=/etc/pki/tls/certs/ca-bundle.crt
With our repo defined we can install Grafana:
dnf install grafana -y
Then after the installation we can start the service and configure it to run on startup:
systemctl enable grafana-server
systemctl start grafana-server
Finally in order to be able to access the web GUI of the Grafana instance we need to make sure the host firewall is open on the Grafana listening port:
firewall-cmd –add-port=3000/tcp
firewall-cmd –add-port=3000/tcp –permanent
Then using a browser we can navigate to the Grafana web GUI:
http://<IP>:3000
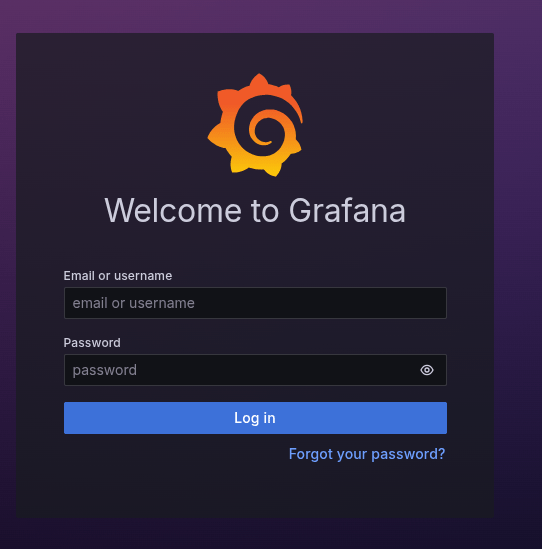
Use the default credentials of admin admin in order to do the first login and then you will be asked to set a new admin password.

Section VIII – Grafana Configuration
Last little bit of configuration to do and then we will be all setup and working. We need to tell Grafana where the Prometheus data is and then we can import an already made dashboard to visualise the Node Exporter data.
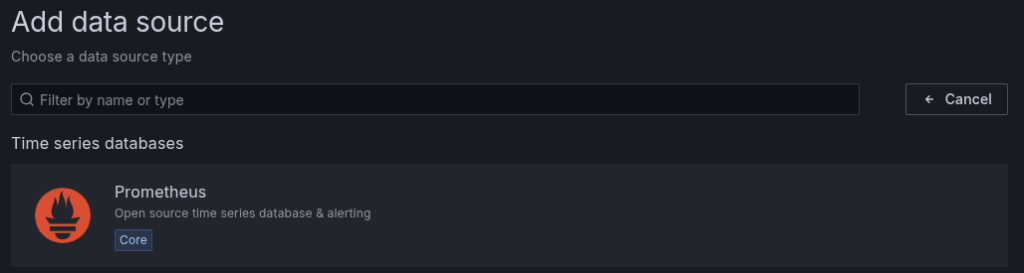
Within the Grafana web GUI navigate to Data Sources under Connections.

Select Add new data source.
Select Prometheus as the type of data source.
Fill out the following settings:
- Name – if you want it to be different from the default
- Prometheus server URL – this will typically be “
http://<IP>:9090“
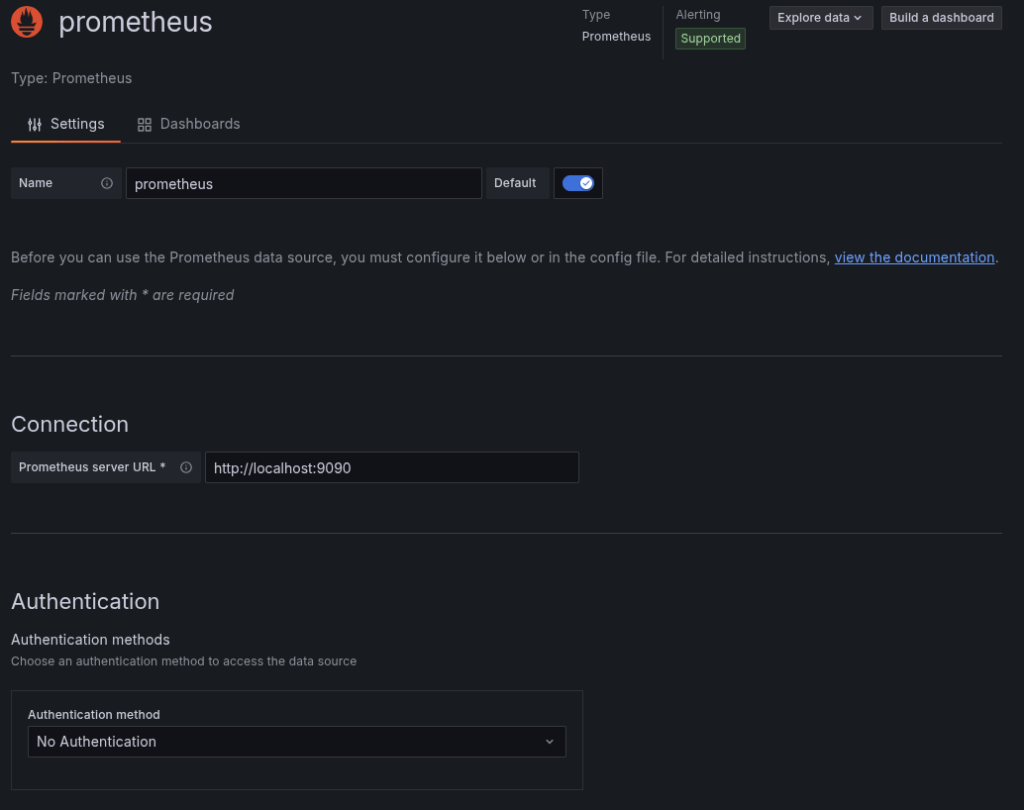
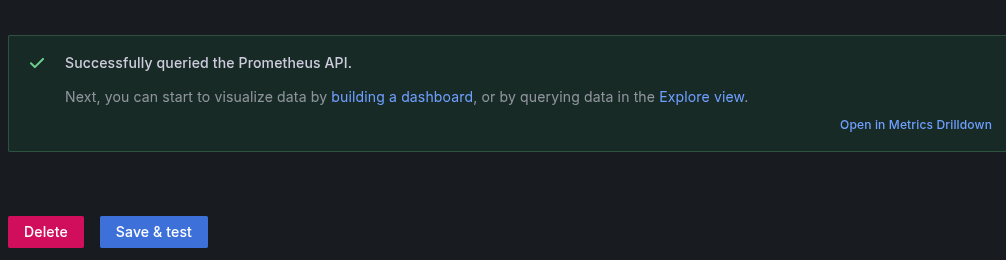
Click Save & Test to ensure the settings are configured correctly.
Then lets get the dashboard in and working by selecting Dashboards.
Then select New then Import.
Put “1860” in the ID field and select load.
Now you will be able to select the datasource and the NodeName variables within your dashboard in order to view all of the data that Node Exporter is collecting for the device.


Leave a comment