Time to read:
In this post, we are going to continue our series on how to install Elastic (ELK) stack1 on Fedora 39. This post specifically will cover how to install Kibana on Fedora 39.
This will require that you already have Elasticsearch installed and configured ready to go. If you need to see how to install Elasticsearch then click here for the previous post in the ELK series.
This article assumes that you have a Fedora 39 machine setup and ready to go with an internet connection. The machine you install Kibana on could be the same as the machine Elasticsearch is on but, it doesn’t have to be. In the case that Kibana and Elasticsearch are installed on different machines make sure that they have network connectivity. In the case of my home lab I have a web proxy so if you have a similar setup make sure that you allow your proxy to forward traffic to the following internet domain name .elastic.co to download all the Elasticsearch application files.
- SECTION I – What is Kibana?
- SECTION II – Kibana Prerequisites
- SECTION III – Kibana Installation
- SECTION IV – Kibana Configuration
- SECTION V – Footnotes
SECTION I – What is Kibana?
Kibana is a web-based user interface that allows the user to visualise and interact with Elasticsearch data. Kibana allows you to navigate the whole ELK stack.
SECTION II – Kibana Prerequisites
NOTE: This section only applies if you are installing Kibana on a different machine to the where Elasticsearch is installed. If you are running Kibana on the same server as Elasticsearch then this section’s contents have already been carried out when you installed Elasticsearch so it can be skipped.
SECTION II – A – Install Java
Before we can install Kibana we need to install Java so that it can run.
- Enter the following command to install Java:
- Once the installation is completed use the following command to configure that Java is installed and the correct version is running as in Figure 2.
dnf install lsof java-17-openjdk java-17-openjdk-devel -y
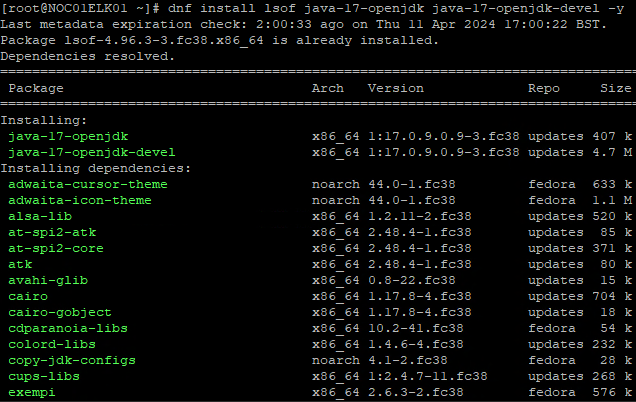
FIGURE 1 – Java Installation
java –version
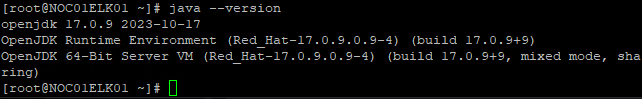
FIGURE 2 – Java Version
SECTION II – B – Add Elasticsearch Repository
Now that we have the required prerequisites we can install the Kibana application.
- Firstly we need to import the GPG (GNU Privacy Guard) key so that when we use the DNF package manager to download and install the Elasticsearch application we can confirm that none of the binary files have been altered. To import the key use the following command:
- Now we need to add the repository for the Elasticsearch source files. Create the following file
/etc/yum.repos.d/elasticsearch.repoand place the contents of Example 1 in the file: - Now we can use DNF to enable the repo using the following command:
rpm –import https://packages.elastic.co/GPG-KEY-elasticsearch
[elasticsearch]
name=Elastic repository for 8.x packages
baseurl=https://artifacts.elastic.co/packages/8.x/yum
gpgcheck=1
gpgkey=https://artifacts.elastic.co/GPG-KEY-elasticsearch
enabled=1
autorefresh=1 t
ype=rpm-md
Example 1 – Elastic Repository
dnf –enablerepo=elasticsearch
SECTION III – Kibana Installation
Now we have our Fedora 39 machine in a state where we can crack on and install the Kibana application.
SECTION III – A – Install Kibana
To start we need to install Kibana. That is done using the following command:
dnf install kibana

FIGURE 3 – Install Kibana
SECTION III – B – Generate Elasticsearch Enrollment Token
When we come to configure Kibana we will require an enrollment token from our Elasticsearch instance to allow the two services to talk.
Navigate onto your Elasticsearch machine via the Command Line Interface (CLI) and enter the following command:
/usr/share/elasticsearch/bin/elasticsearch-create-enrollment-token -s kibana
You will see the enrollment key outputted to the terminal. Take a copy of this key and store it in a safe place as you will need it later on in Section IV.
SECTION III – C – Basic Kibana Configuration
Kibana has a configuration file stored in its ‘/etc/kibana/’ directory.
Open up this configuration file:
vi /etc/kibana/kibana.yml
With the file open edit the following 2 lines listed in Example 2 and make sure that they are appropriate to your setup. NOTE: in my case, I am running Kibana and Elasticsearch on the same machine so I am using a loopback as my Elasticsearch host address. If you were running it on its own machine then enter either the Internet Protocol (IP) address or the Domain Name System (DNS) name.
server.host: "0.0.0.0"
elasticsearch.hosts: ["http://localhost:9200"]
Example 2 – Kibana.yml File
SECTION III – D – Start Kibana
With the basic configuration of Kibana done, we can now start the service and set it to start on boot. Use the following commands to do so:
systemctl start kibana
systemctl enable kibana
You can use the following command to check if the Kibana service is now running:
systemctl status kibana
SECTION III – E – Open Firewall for Kibana
To be able to access the Kibana web Graphical User Interface (GUI) we need to allow the port that is uses through the host firewall on the machine. By default, Kibana uses Transmission Control Protocol (TCP) port 5601.
Use the following commands to allow that default port through the firewall: NOTE: my interface is in the internal zone, if your interface isn’t then leave this off the commands.
firewall-cmd –add-port=5601/tcp –permanent –zone=internal
firewall-cmd –add-port=5601/tcp –zone=internal
SECTION IV – Kibana Configuration
With the Kibana service now working we need to head to its web GUI to find its initial setup and get it connected to Elasticsearch:
- Using a web browser navigate to ‘http://<Kibana IP>:5601’.
- Once the page loads you will be presented with a dialog box to enter the enrollment token into. Paste in the enrollment token you generated in Section III – B and then click ‘Configure Elastic’.
- On the CLI of your Kibana machine run the following command in order to get the Kibana verification token:
- With the output from step 3 enter that into the web GUI.
- You will see Kibana go through and set up.
- Once completed you will be presented with the Elastic login page. Use your ‘elastic’ account to login to Kibana.
- Now that you are logged in you can make use of all of the features and visibility from Kibana.

FIGURE 4 – Elasticsearch Enrollment Token
/usr/share/kibana/bin/kibana-verification-code
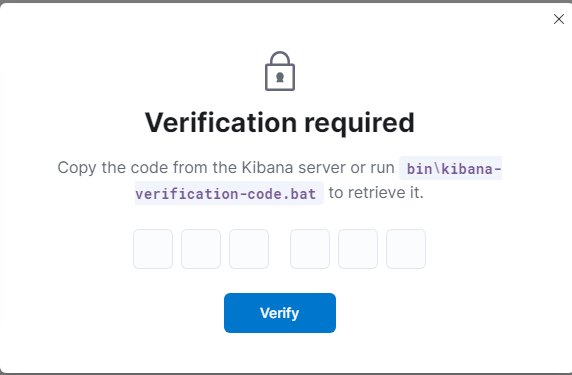
FIGURE 5 – Kibana Verification Token

FIGURE 6 – Kibana Auto-Setup

FIGURE 7 – Kibana Login Page

FIGURE 8 – Kibana HomePage
SECTION V – Footnotes
- ELK Stack – this is a term used to refer to multiple services that have an end goal of ingesting data from any source in any format and providing a way to reliably and securely; search, analyse and visualise that data. ↩︎

Leave a comment